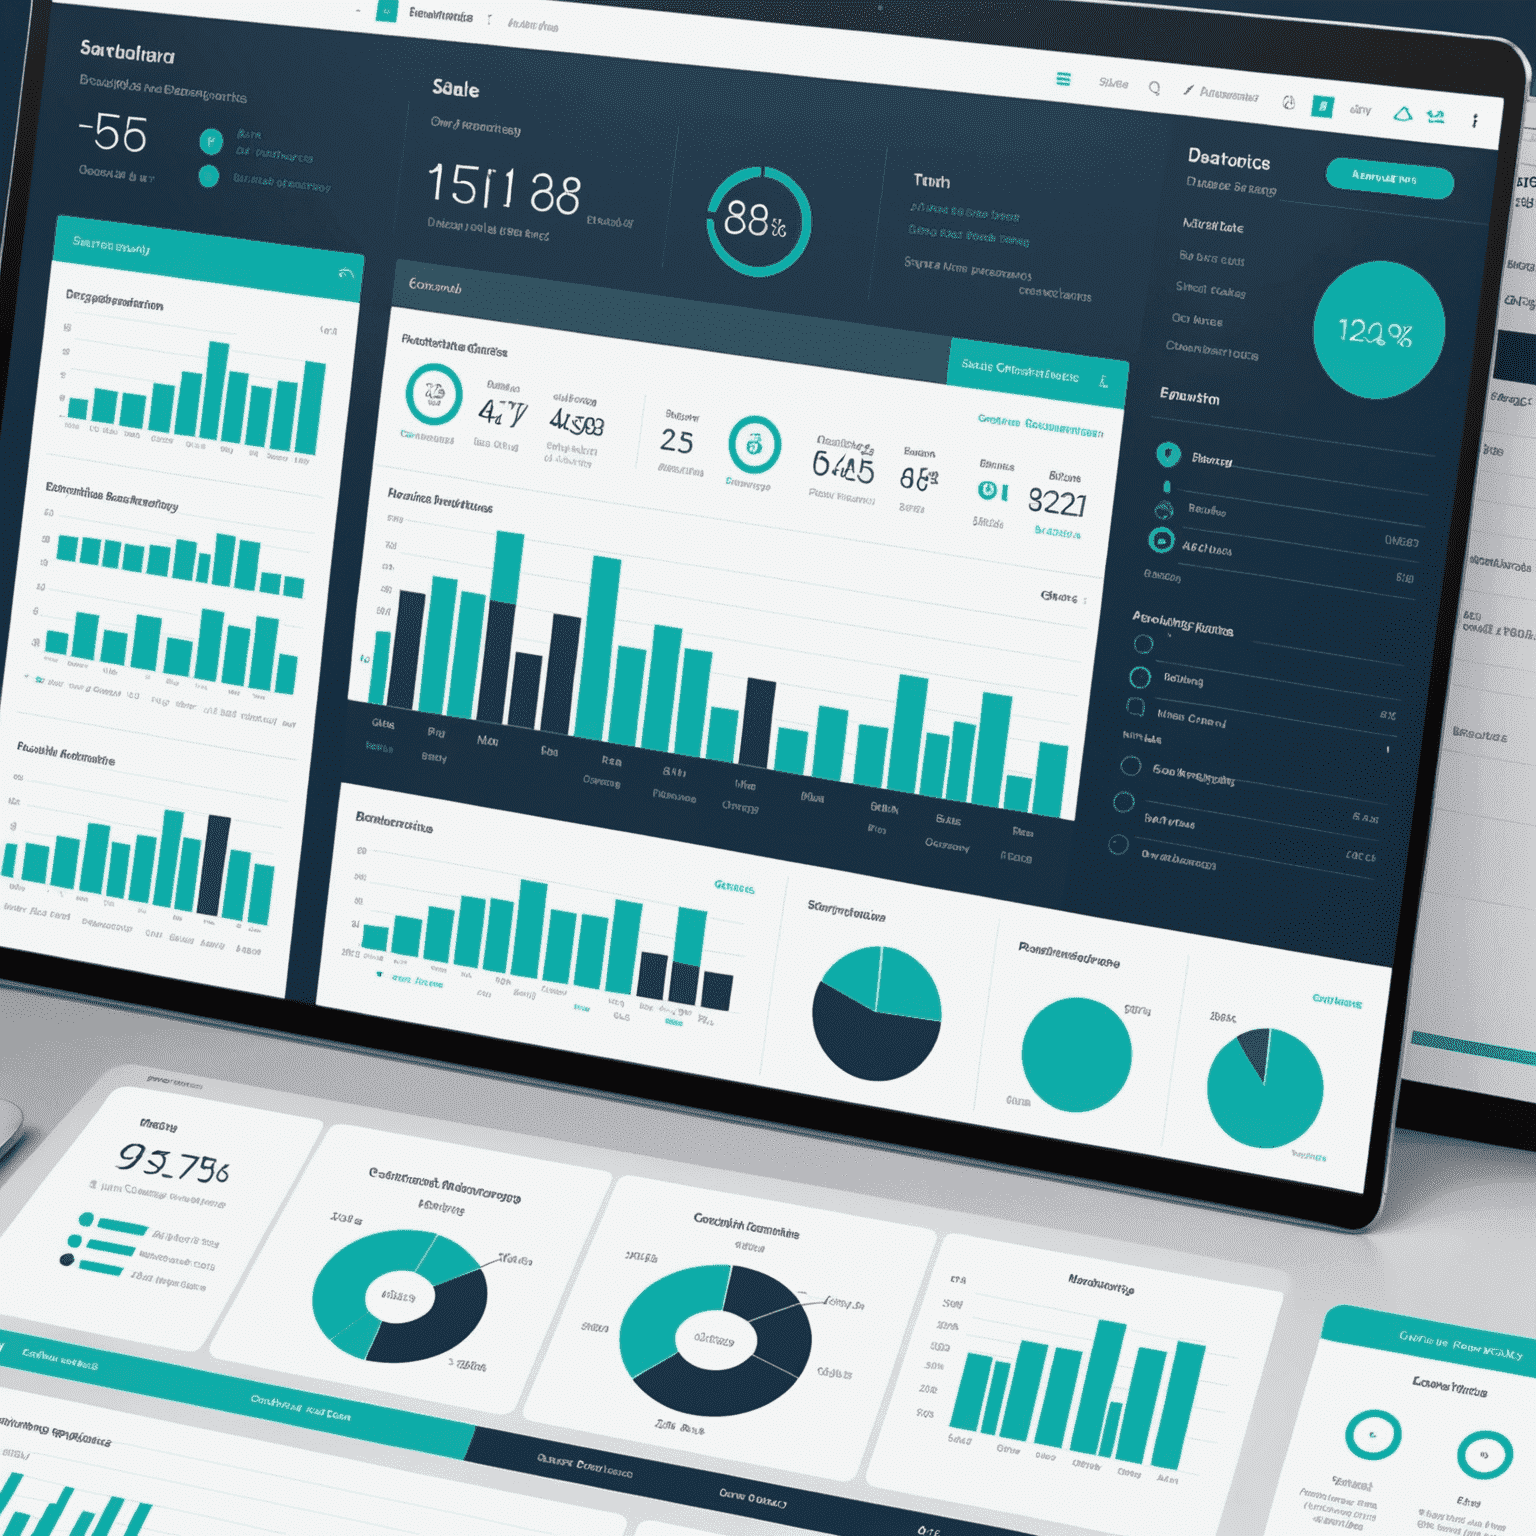
Dashboard Design and Implementation
At Data Visualization Assistant, we specialize in creating custom, user-friendly dashboards that consolidate your key metrics and KPIs. Our expertly designed dashboards enable real-time monitoring and informed decision-making across your business.
Why Choose Our Dashboard Services?
- Real-time data visualization
- Customized KPI tracking
- User-friendly interface design
- Responsive across all devices
- Secure data integration
Data Consolidation
We bring together data from multiple sources, providing a single source of truth for your business intelligence needs.
Interactive Visualizations
Our dashboards feature interactive charts and graphs that allow for deep data exploration and analysis.
Customized Reporting
Tailor your dashboard to display the metrics that matter most to your business, ensuring relevant insights at a glance.
Our Dashboard Design Process
- Requirements Gathering: We work closely with you to understand your business needs and KPIs.
- Data Analysis: Our experts analyze your data sources and structure to ensure optimal integration.
- Prototype Design: We create wireframes and prototypes for your approval before implementation.
- Development: Our team builds the dashboard using cutting-edge visualization tools and technologies.
- Testing and Refinement: We rigorously test the dashboard and refine based on your feedback.
- Deployment and Training: We deploy the final product and provide comprehensive training for your team.
Benefits of Our Dashboard Solutions
Improved Decision Making
Access to real-time data enables faster, more informed business decisions.
Time Savings
Automated reporting reduces time spent on manual data compilation and analysis.
Increased Efficiency
Streamlined data visualization leads to quicker identification of trends and opportunities.